In Power BI Visual Reports, you can use tooltips to provide additional data for specific data points in which the user is interested. By hovering with your mouse over the datapoint, the tooltip is shown, thus providing (additional) information. There are a lot of applications for these tooltips. For example, you can use them to give the report user the exact data value of the data point, so that you can hide the data labels and avoid some cluttering on your report page. Another application is to use tooltips to provide additional information for this data point, which the report user would not have gotten from the original visual.
There are two methods to create tooltips in Power BI: there is the standard tooltip visual, in which you can add measures that will give a value and a label in a simple pop-up screen to the report user when he hovers over the data point. The other option is to create a custom tooltip page. In these custom tooltip pages, you can use any Power BI visual to display the additional information, thereby creating a much more appealing way to give your report user some more information.
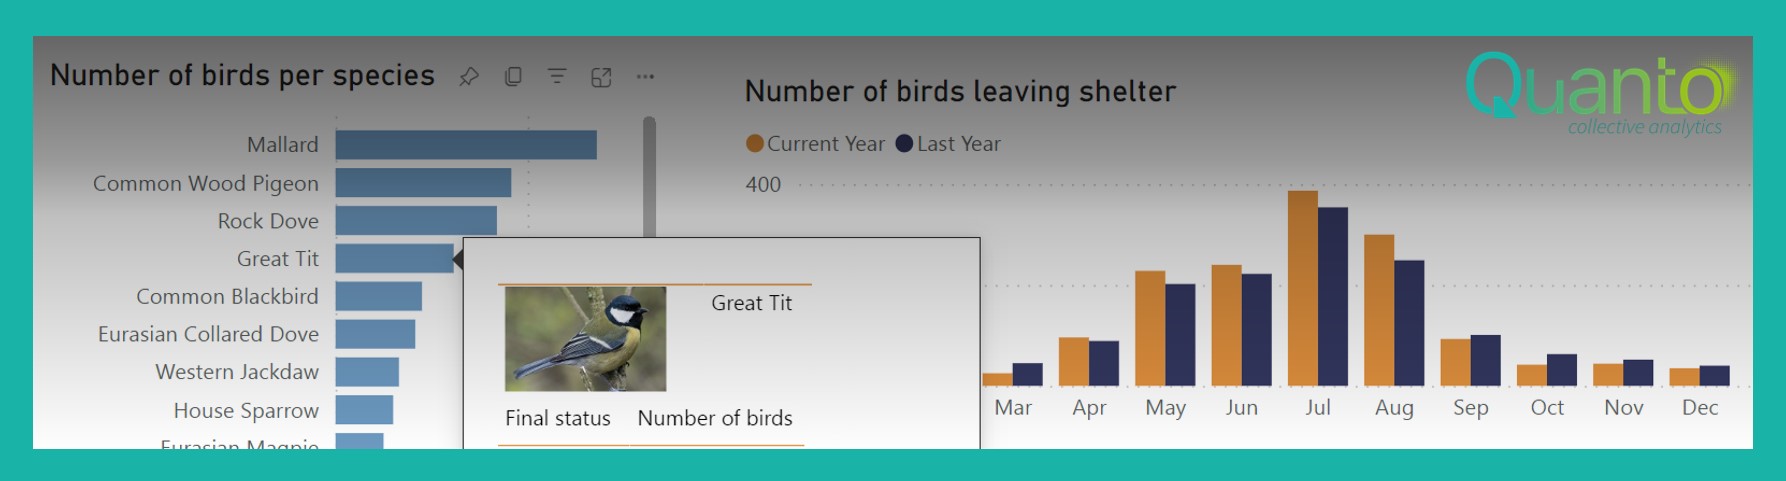
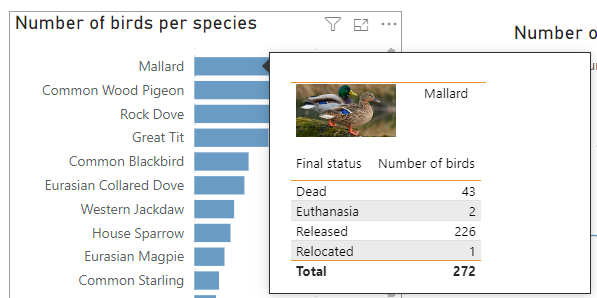
In this blog post, I will show you how to get these pictures in custom tooltip pages, and thus creating a real visual tooltip for your data, like the one shown below. This tooltip provides some additional information and a small picture of the bird species we are interested in:
There are several ways to import the pictures that you would like to use: if the pictures are available somewhere on the web, you can use the web url directly in your data columns. Another way is to store the pictures somewhere locally or on a shared drive, and create an image url from the binary source. This is possible to do with a custom function in Power Query. You can define a custom function in Power Query with the following M code:
(BinaryContent as binary) as text =>
let
Base64 = “data:image/jpeg;base64, ” & Binary.ToText(BinaryContent, BinaryEncoding.Base64)
in
Base64
This code converts your binary source (which can be an ordinary jpg file) to a Base64 image url, which you can use in your visual report.
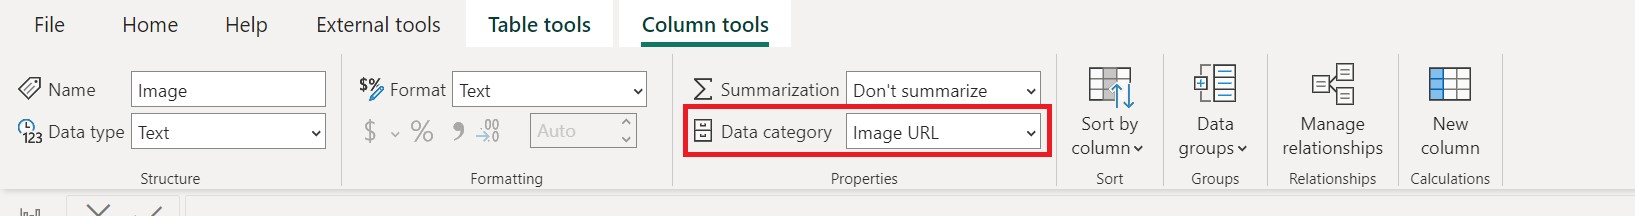
In both of the above methods, after loading the data in Power BI, you have to mark the column as an Image URL Data Category. This can be done in the Data view of Power BI, by selecting the column and then selecting the “Column tools” in the ribbon. Here you can define the Data category of the data to be Image URL, indicating that it is indeed an Image URL:
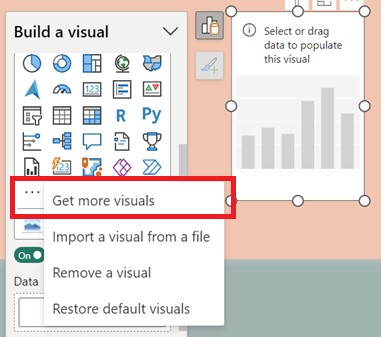
Now you are ready use the pictures in your Power BI Visual Report! This can be done for example in a table visual, by dragging in the column which you just marked as an Image URL. The downside of using table visuals can be that they also have a header for the column, and a border between the header and the picture. You can customize all this in the formatting pane to create a view that you’re happy with, but you can also look for custom visuals to show your pictures in a nice way. For example, I have used the “Simple Image” visual from Vincent Faigt, which is (as the name suggests) just a simple visual to show an image and worked for me at the time. You can add custom visuals to your report either by adding a new empty visual to your report, scrolling down to the end of the visuals type and selecting the “Get more visuals” option behind the three dots:
The other (and probably easier) option is by clicking the “More Visuals” button in the Home ribbon and selecting “From AppSource”:
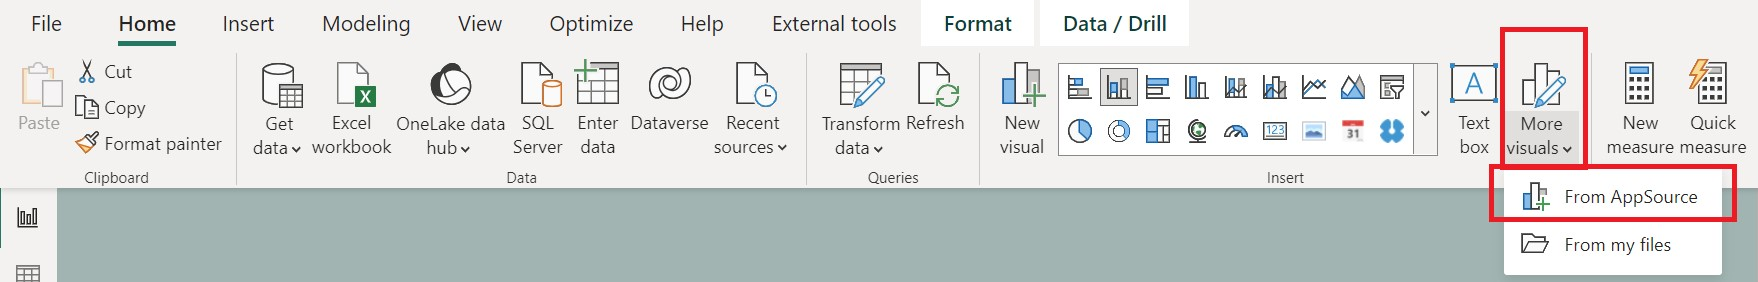
In the AppSource you can find a lot of custom visuals that you can add to your report. Note that some are not PBI Certified, and some may have very specific inputs before you can get them to work with your own data. However, there are a lot of nice custom visuals that you can explore and use here.
So, now you can add pictures in your Power BI Visual Report, but the original goal was to create tooltips with pictures. Luckily, everything is now also set to add the pictures in your custom tooltip page, because you can add any Power BI visual in a custom tooltip page.
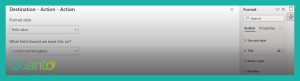
To create a custom tooltip page, create a new page in your report and select the Page Type “Tooltip” in the Page information of the Format pane:
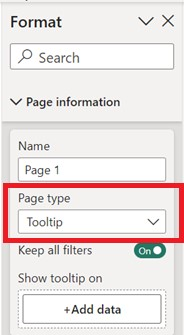
The canvas will adapt to a smaller size, which you can also change if you want to. You can select on which column of your data you want to have the tooltip by selecting that column in the “Add data” section. Please note that there is a bug in the current version of Power BI (2.119.870.0 64-bit (July 2023)), that makes the Page type jump to “Drillthrough” and creates a back button on your canvas whenever you add a column in the add data section. You can just set the Page type back to Tooltip and delete the newly created back button, but be aware of this bug (that has already been mentioned to Microsoft as well). However, it is not necessary to add data to this field to use it as a tooltip page, so you can also skip this step.
When designing you custom tooltip report page, make sure that your Image URL column in your data is either filtered correctly in your data model, or that you have written explicit measures that make sure you select the correct value for the picture that you want to show in the tooltip. A best practice is also to hide the tooltip page, so that your report users can only access it as a tooltip. Now you’re ready to create beautiful visual tooltips for your report!
It is also possible to make your custom tooltips dynamic, by combining them with a field parameter for example. But that may be content for a new blog later on.