In this third blog about achieving a different mindset when you want to change your business tools from Excel to Power BI. In the first blog I wrote about the definition of a normalized table and in the second blog I wrote how to create a normalized table. In this blog I want to talk about where to store, use and do transformations on a normalized table.
There are two options to get your data from a database to Power BI. Using a direct connection or by using in-between files to store your tables. By far the best option is the first one: create a direct connection to a database. Within Power BI and Excel Power Query there are all kind of connectors available for all types of databases.
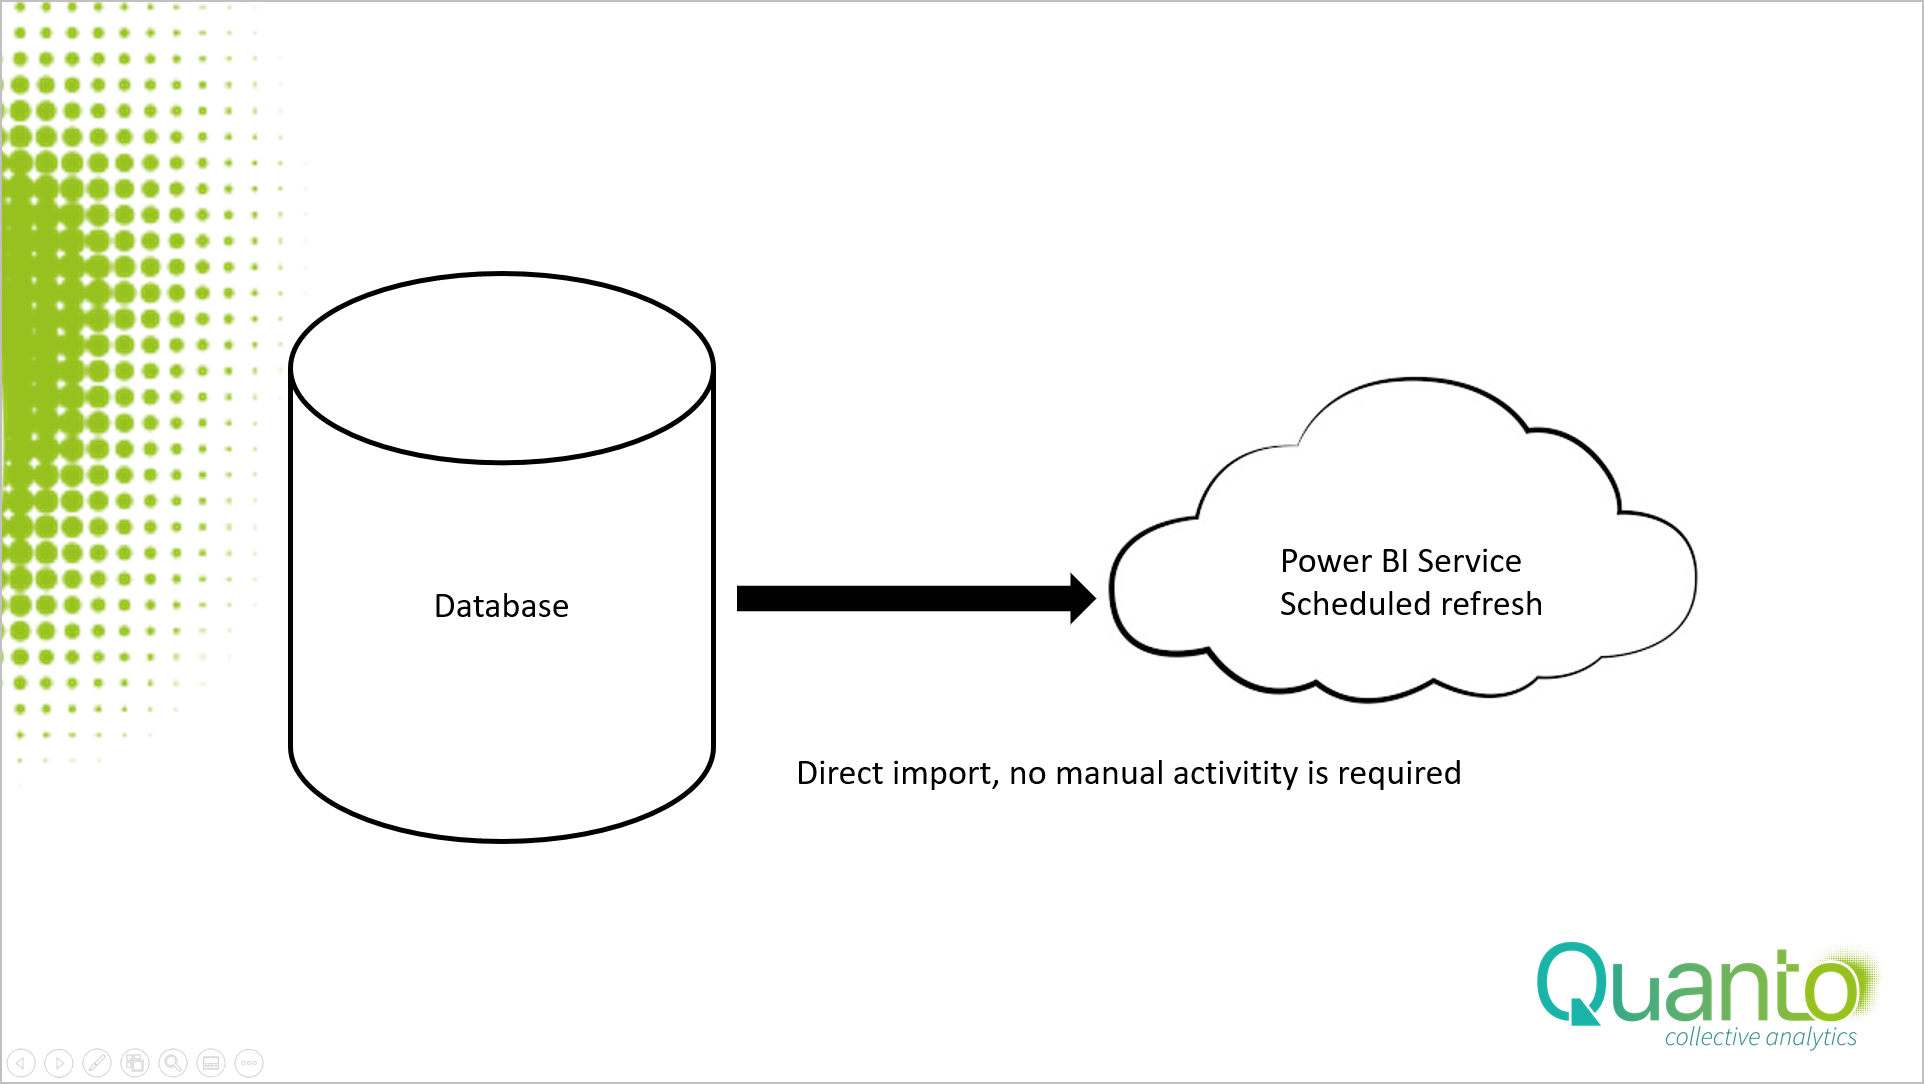
Just adding the correct gateway within the service, enable the scheduled refresh option and you have never, ever to worry about updating your model. With a Power BI Pro license, you can refresh the data and the model up to 8 times a day. Compare this rate with your standard Excel “once a month” updated business reports and you find the benefits.
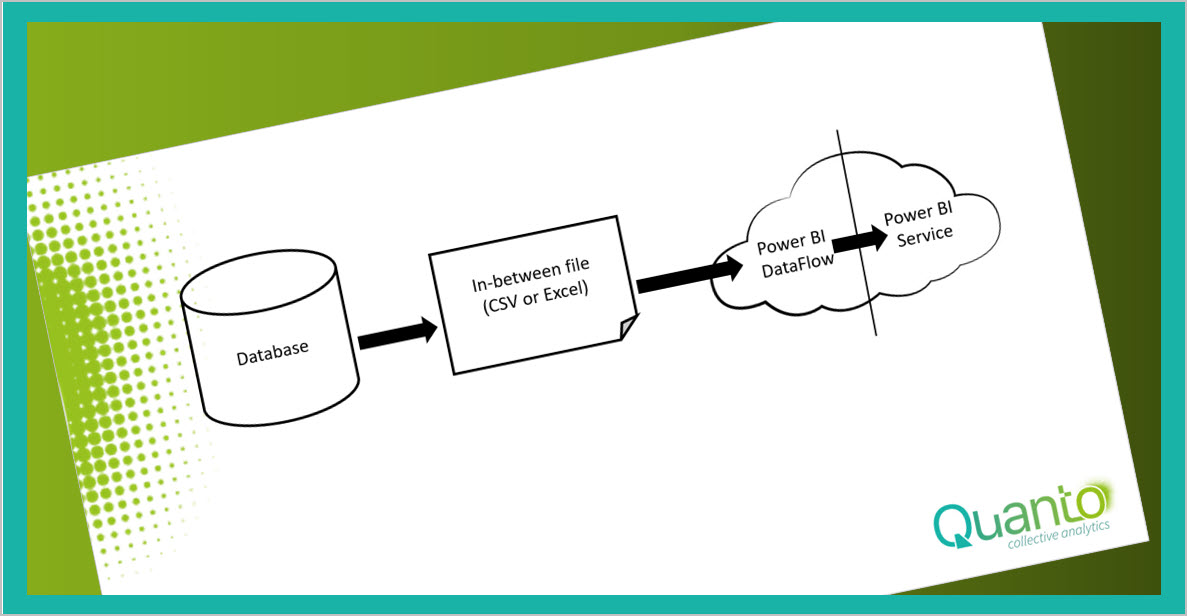
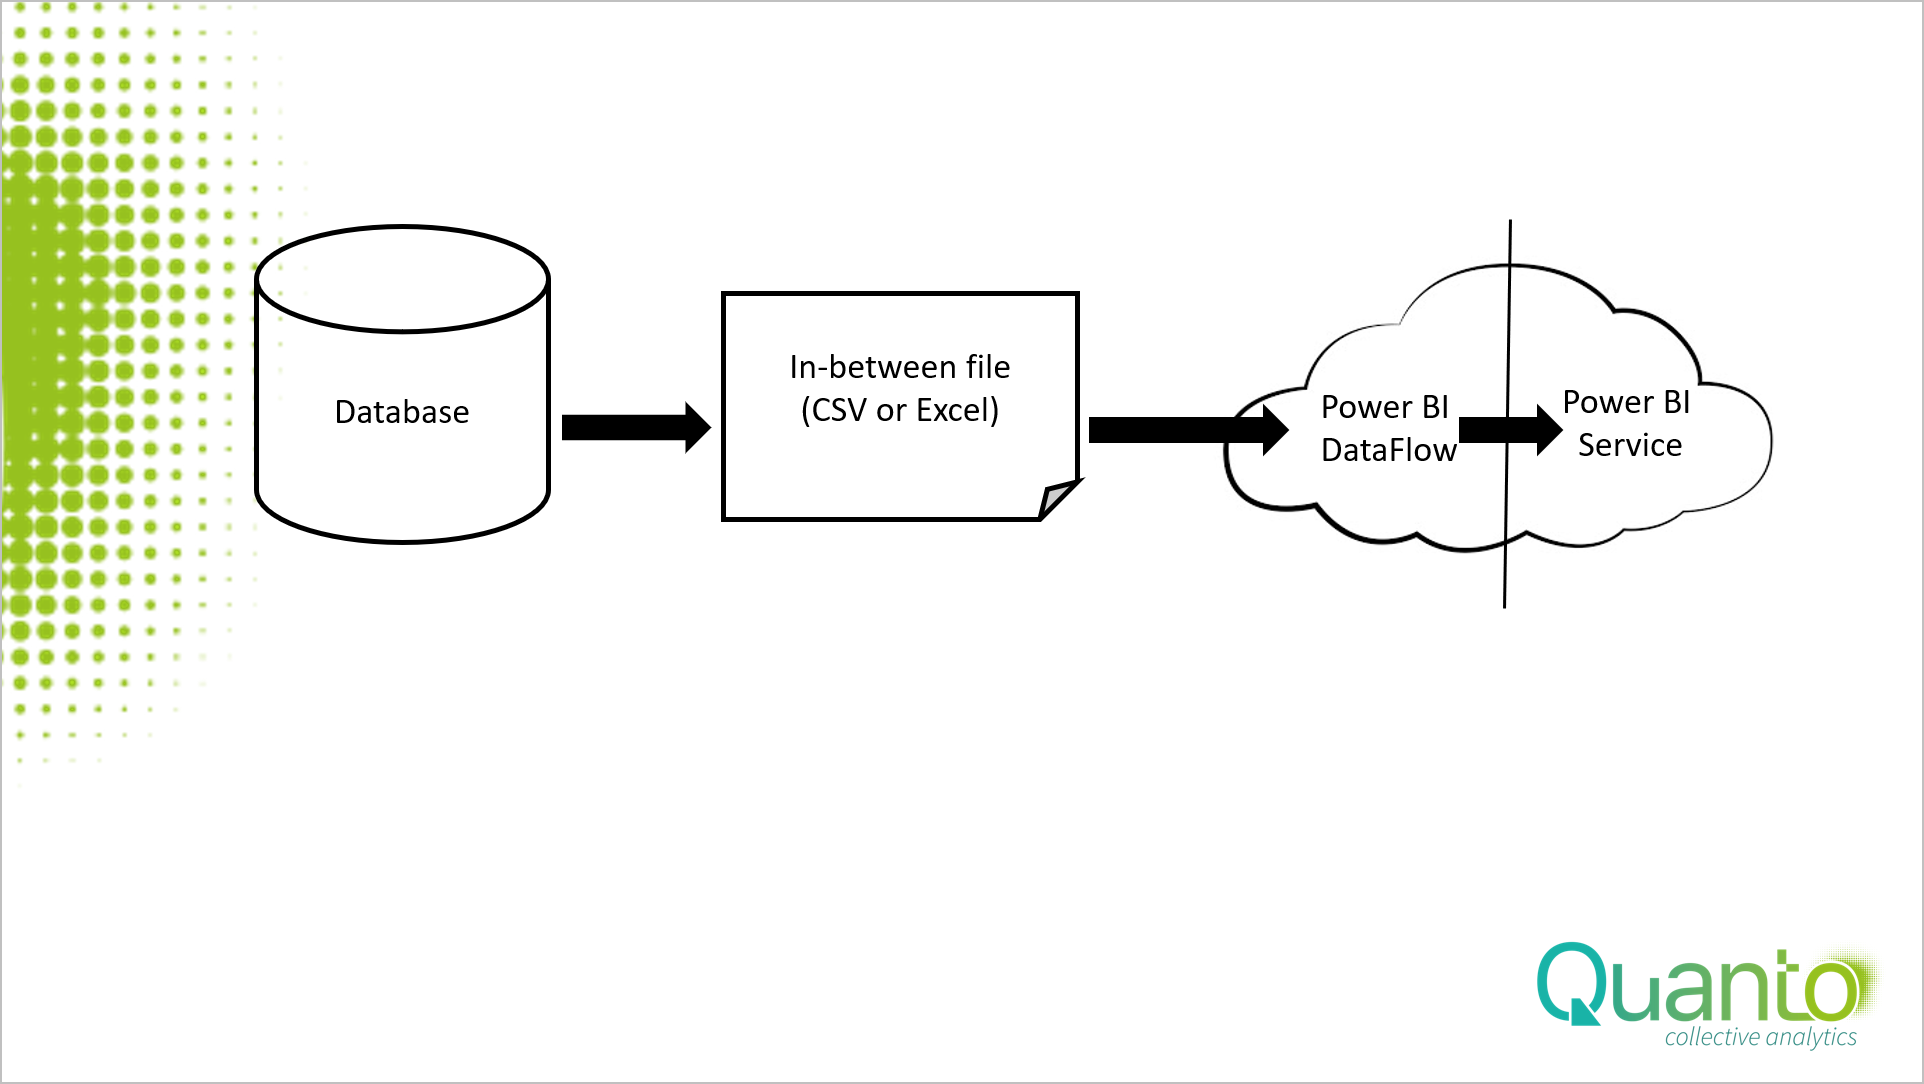
But what if you do not have that luxury? What if you do not have the permission to directly connect to your databases and you can only download tables in a CSV or an Excel file? Consider the second option and make use of in-between tables.

Your options in this scenario depends on the interface of the database host. There are hosts allows a schedule to automatically push the table data through a template into a file. In that case you are lucky. You only need to synchronize the push and refresh moments: first the push must be achieved. After the file is created the Power BI scheduled refresh import should be activated to update your Power BI reports. Since all actions are carried out automatically, you create a cycle that -like the first option- runs automatically. One of the best practices is to create one central location with a set of folders for your periodically downloaded data, where all the necessary in-between tables are placed. It is not advised to shatter the in-between tables all over your drives.
If something in this process failed, it can take a while before you know the failure. If for instance the push is delayed, the updated data might not be passed to the model. This hurts even more if some of the tables are refreshed and others not. So, calculate the push and refresh moments with care. And do not forget to enable the (email) notifications for push and refresh failures. That sounds obvious, but I know situations where it took a while before a repeatedly refresh failure was notified by the report owner.
But what to do if your database interface does not allow a scheduled push of the data? In that case you are bound to do the push of data manual. You also need to create a central storage place.
Preferably two employees, the download managers, are responsible for refreshing the data on an agreed schedule. Of course, position and table should never be changed. All Power BI models are connected to that set of tables and expect exact names and table structures. This set up brings you as close as possible to the automatically push and refresh scenario.
In the manually pushed table scenario you can still do the scheduled refresh from the Power BI service, but I would not recommend doing that. The scheduled refresh might fail if you are delayed and you are still busy pushing the tables. As a rule of thumb, I would recommend, if you need to do a manual action in a refresh cycle, it is best to run the complete cycle manually.
I both scenarios it is obvious that the downloaded files should only be used as in-between tables. If Power BI dashboards are connected to the tables, no one – even the download manager- is allowed to change to the data in the table, otherwise the dashboards in your BI models may fail or even worse, display the wrong results. Also, be aware that you might export a lot of data from behind the protected area of the database into a more open business environment. In both cases you should consider security precautions.
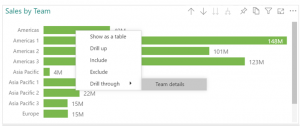
Now let us have a look at your options are if you need to do transformations on the required data. As said in my previous blog, manual adding transformations is a bad practice. So, you do have the following options left.
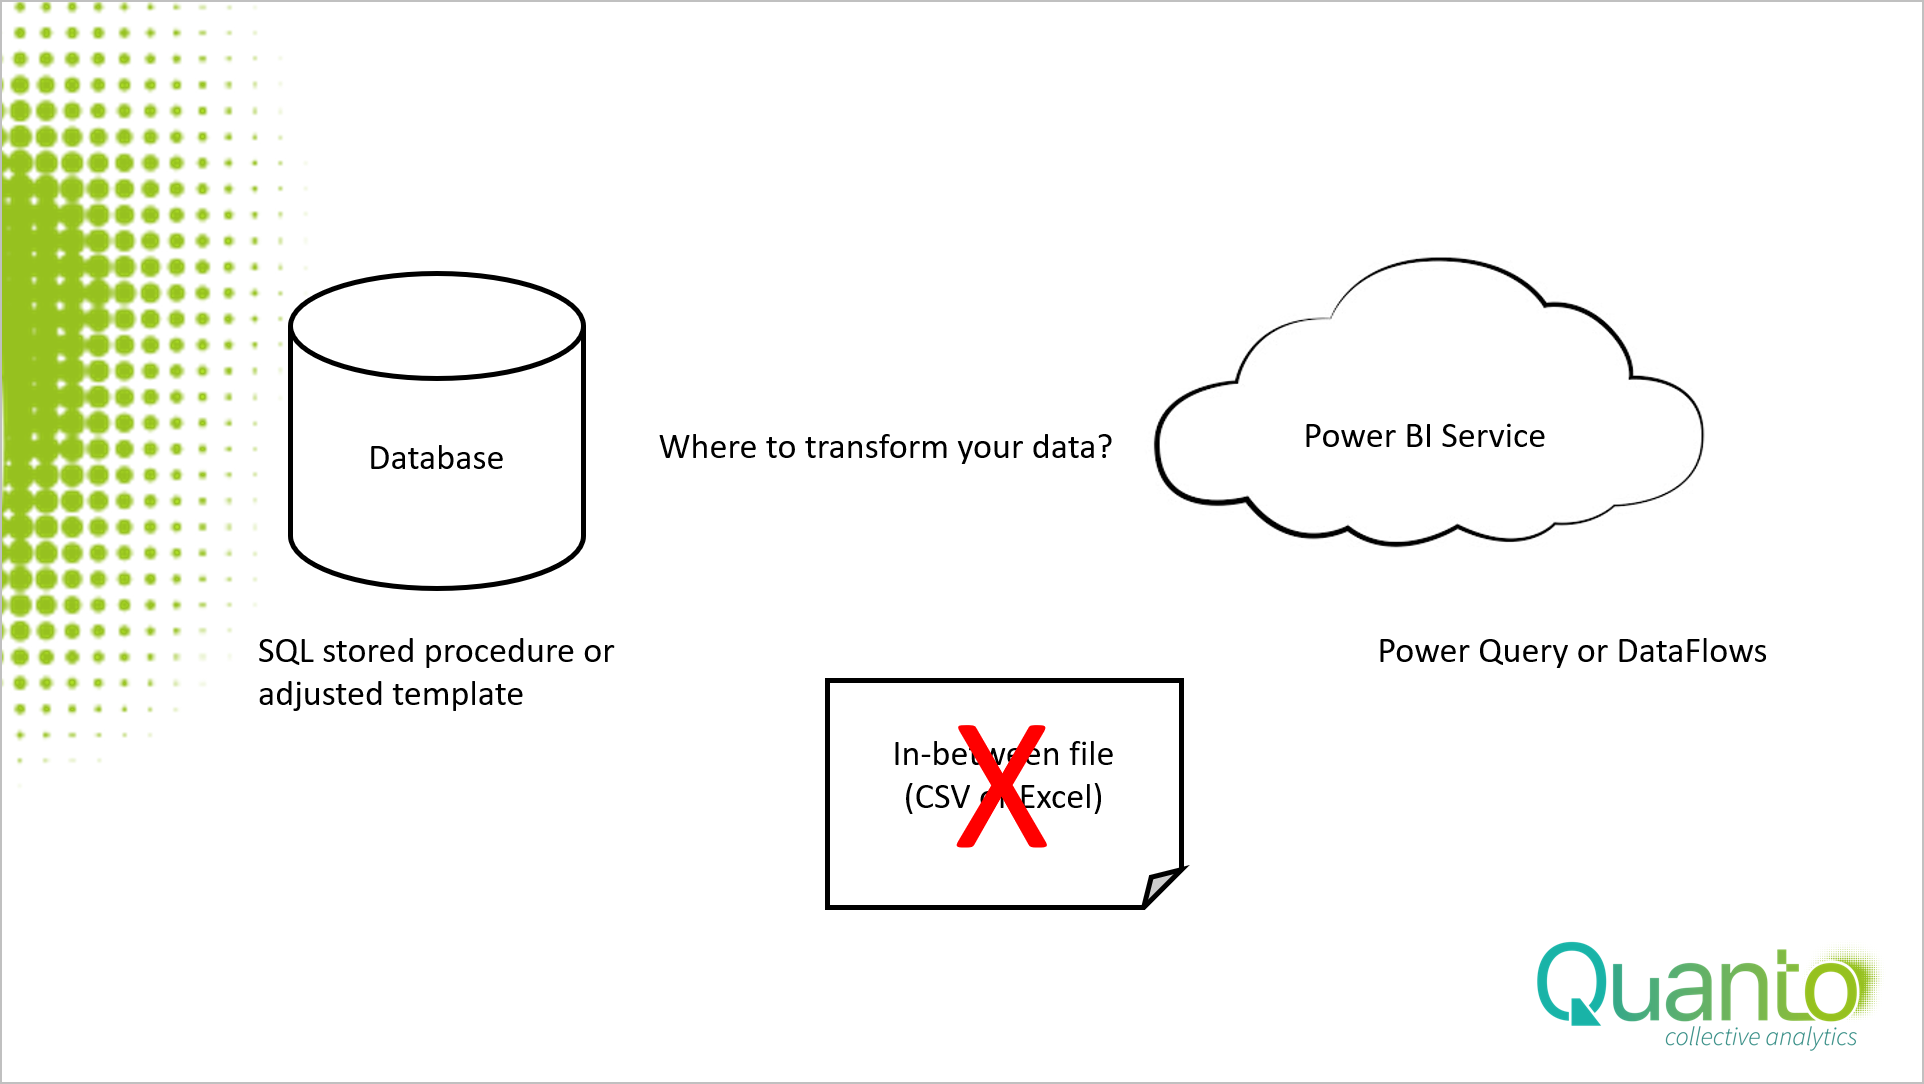
I start with the option you should never use. Do not create transformations on the in-between table. After each push the old file with the transformation will be overwritten and you need to do the transformations again and again. That means manual labor and with that potential errors. As said earlier, you do not want changes the in-between files. The positions left to do the transformations are on the start and end points of the cycle.
Either you do transformations in the host database, or with Power Query in the Power BI model or use Dataflows. A combination of these options is also feasible. I would recommend using the database template to create a basic table, e.g., adding (key) columns, some rudimental filtering etc. and use Power Query for the more sophisticated transformations.
Most of the regular business users have permission, at best, to adjust the push template. As said, there is nothing wrong in adding key columns and create a push schema. I urge you to do so. It will make your (business) life much easier.
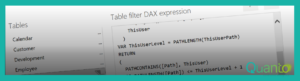
But if you need to do more complex transformations, you best to do this in Power Query at the end point of the cycle. Before you begin the transformations, there are some considerations. For instance, in the way you want to use the normalized table in your Power BI models. If you create transformations for just one Power BI model, you are good to go by creating a script in that model. But what if you want to use that transformation in multiple models? Either you create (or copy) the Power Query script for each model. This scenario has its pitfalls since you have multiple scripts to maintain. So, if you want to use a normalized table in different sets of Power BI models, DataFlows are the way to go.
DataFlows is a feature in Power BI Service, where you store a table by using a Power Query M-language script and re-use that table in numerous Power BI models. Basically, you drag the M-language script out of your model and use that script to create a table in the cloud. It works like this.
Be aware that DataFlows uses its own scheduled refresh and its own gateway. If you refresh data by this scenario, be prepared that you get three different moments in time. First the push of the tables into the in-between file, then the refresh of DataFlows with the in-between tables and finally the refresh of the model on the DataFlows tables.
In my next blog I want to write more about DataFlows, to give you more insights in how to use this feature.