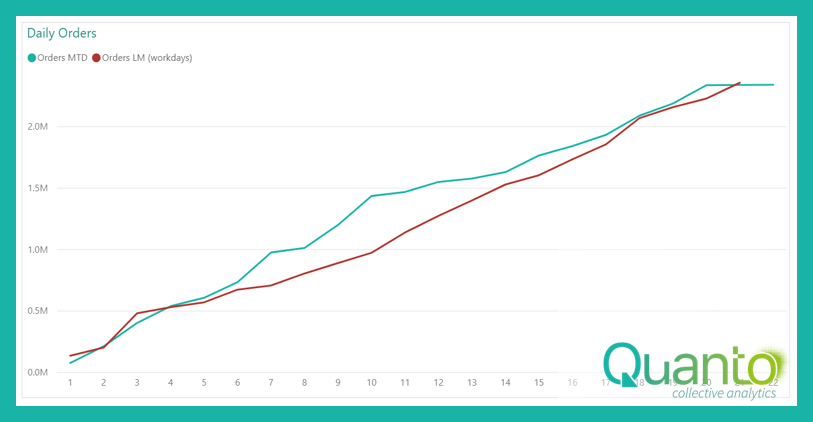
This article is a follow-up to the AutoExists introductory post and one with an example on time intelligence based on workdays. In the latter, we created the month-to-date chart below, comparing one month’s data (June 2020, in this case) with the previous month.

Looks OK, right? As you can see, the red ‘last month’ line only extends to workday 21. This is because the month of May 2020 only has 21 workdays, so starting from workday 22 in June, you cannot go back one month. Now let’s look at the same chart, but for May 2020:
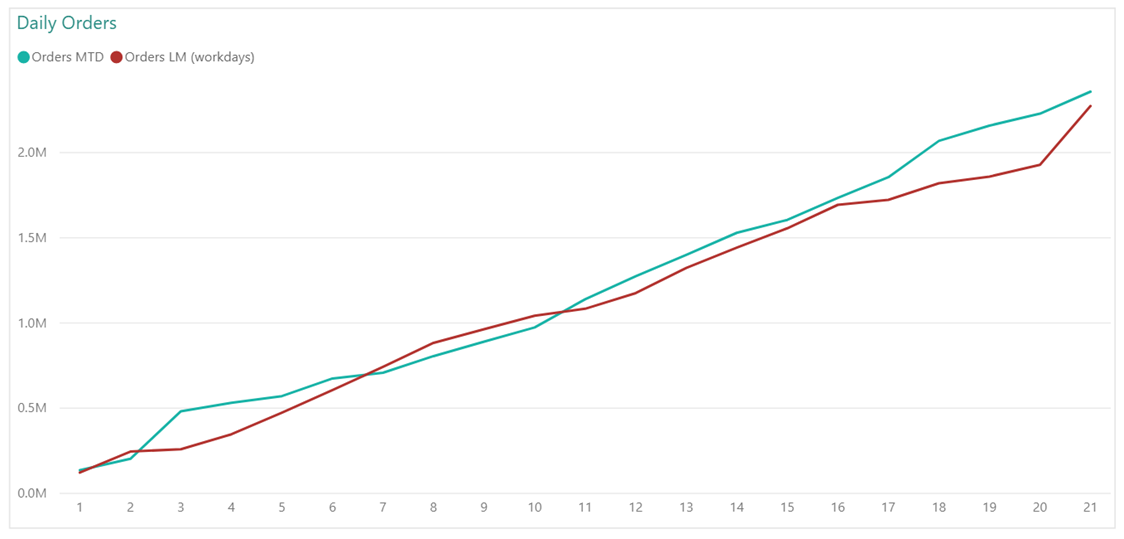
As you can see, the X-axis now only shows data up to workday 21. The red line, which is April 2020 now, also shows data up to workday 21. But here is the problem: April does not have 21 workdays, but 22! Clearly, we miss one day of data in this chart.
This is a case where we find AutoExist in our way. As we have filtered the report on the Year ‘2020’ and Month ‘May’, and the column [Workday in Month] is in the same table, Calendar, as [Year] and [Month], Power BI decides that no evaluation of workday 22 is needed.
There is really no way to get around this, except by changing the model in such a way that the [Workday in Month] column is not in the Calendar table. This will cause Power BI to evaluate all selected combinations of [Year], [Month], and [Workday in Month], including workday 22 with May 2020 (of course, [Year] and [Month] are still in the same table meaning only May 2020 will be evaluated).
To make this work, we need a separate Workday table which is simply a single-column table with the numbers 1 to 23 (the maximum number of workdays in any month). The model now looks like this:
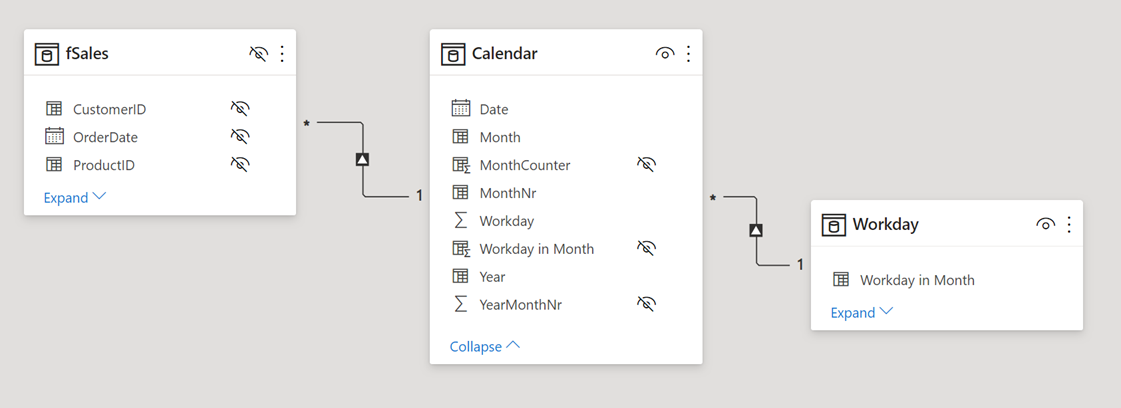
Yup, that’s the new model view there… We have a relationship between the Calendar and Workday tables, because obviously Power BI needs to be able to determine which date corresponds to a certain workday number.
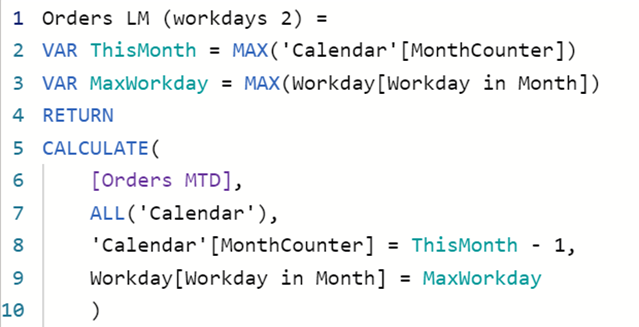
The measure formula needs to be changed to reflect that when the [Workday in Month] column is used, it is taken from the new Workday table:
With this measure, we can create the chart below.
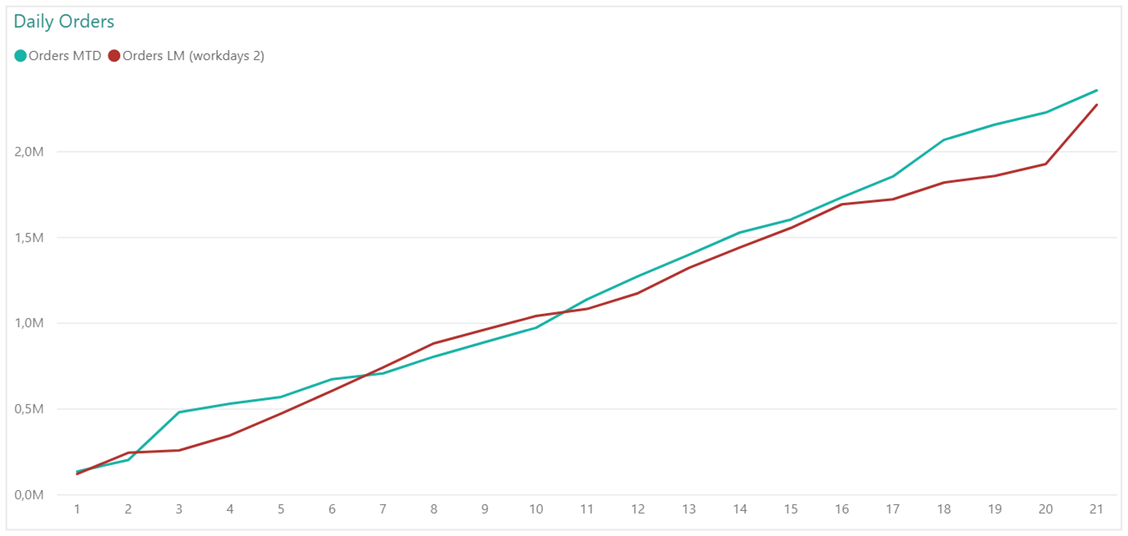
What? Still no workday 22 in sight. Why is this?
Remember that although workday 22 will now be evaluated, we still have to work with the context created as usual. The filters in this context are:
- [Year] = 2020
- [Month] = May
- [Workday in Month] = 22
As there is no workday 22 in May 2020, this context contains no rows in the Calendar table. This means that in the [Orders LM (workdays 2)] measure, the variable ThisMonth has the value BLANK. Consequently, the filter argument in line 8 says that the [MonthCounter] column should have the value -1. There is no row in the Calendar table that satisfies that requirement, and therefore the result of the calculation is BLANK, and the visual finds no need to show workday 22 on the axis.
We need to change the DAX formula as follows:
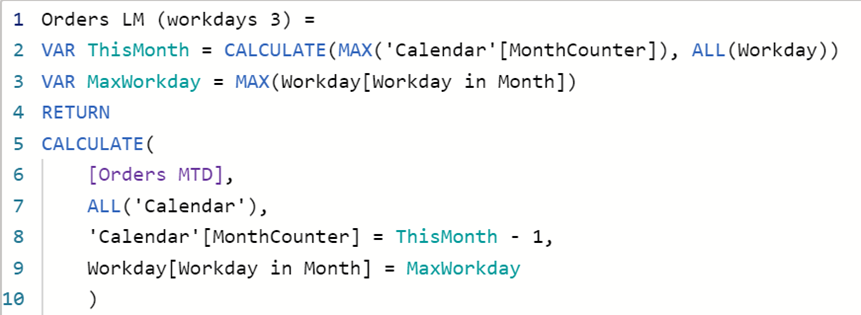
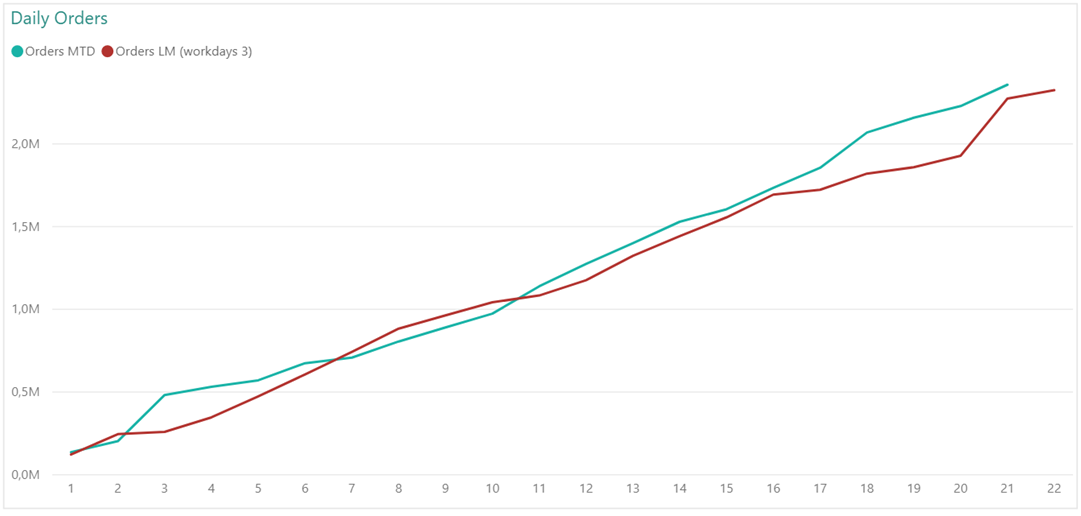
Now, the variable ThisMonth disregards filters on the Workday table, so that the current month is correctly calculated. This measure now works as expected:
This shows that although AutoExist is a good approach to minimize calculations in Power BI, we cannot do without ways to get around it.