In my previous blog post, I have shown you one method to create dynamic buttons in a Power BI visual report, resulting in a dynamic drill through page. In this second part, I will show another method to create dynamic buttons, with but a different idea in mind.
In this blog post, we will explore the option where the dynamic part is depending on conditions that are outside of the selections that a user makes in the report. The idea is to create a certain flow, where the user is only allowed to go to a specific page once a condition is satisfied. If the condition is not satisfied, the user should be directed to a different page.
There are multiple use cases where this can be applied: for example, there could be a Power Automate Flow that is triggered from a button in a Power BI visual report page, but the Flow may only be triggered if some specific data has been checked by an employee and got the status of “approved”. Or maybe it may only be triggered on a Friday, or when the Sales for the day exceed some threshold value.
These are external conditions, based on the day of the week, or some specific value of the data, which is not necessarily the data that you are selecting or viewing at the moment you are using the report.
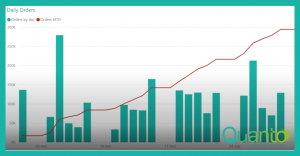
In our example data, suppose that we close our financial books each week. On the first day of the next week (say, the Monday), you want to be able to view the sales and costs per week, and compare the different weeks with each other and with the corresponding week of last year. But during the week, on all the other days, you are mainly interested in how the current week is developing: what are open sales orders that are not yet booked, but may still become sales in the current week? What are all the sales and costs per day?
You can create two pages in the Power BI visual report, one page for the current week data, where you can see the details per day, and the specifics that are relevant for the current week, and another page with data for the whole year, where you can compare the different weeks within the year, but also with the corresponding week of last year.
Suppose you create a button to navigate to these pages, but it should be conditional: when it’s a Monday, you want to navigate to the yearly data page, because it makes no sense to look at the current week, since it’s just started and there is no data for that week yet. On any other day of the week, you do want to navigate to the current week data, because you want to monitor how this week is going.
Suppose your two pages are called “Yearly Data” and “Current Week”. In order to create a dynamic button, you need to make a measure that defines your condition as well. In this case, you want to create a measure that returns the value “Yearly Data” if today is a Monday, and else “Current Week”. This measure could look like this:
Conditional Navigation =
IF(
WEEKDAY(TODAY()) = 2, //by default, Sunday is weekday 1, thus Monday weekday 2
“Yearly Data”,
“Current Week”
)
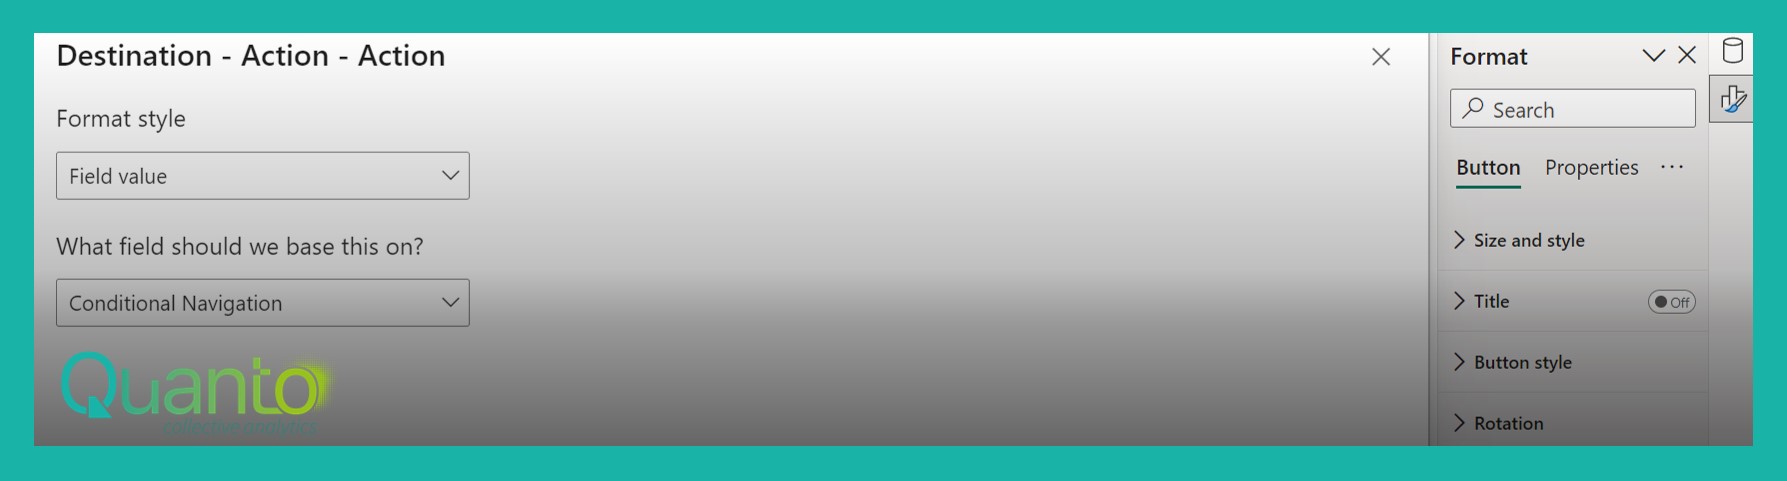
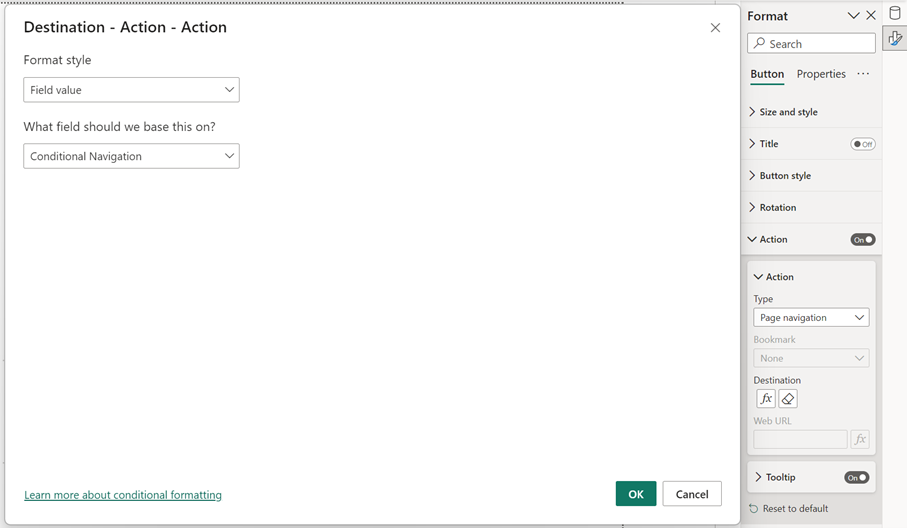
The last step is to create the button, with an Action Type of Page Navigation, and use your new measure in the conditional formatting option of the Destination:
Now you have a button that will navigate to the Yearly Data page only if it is a Monday, and to the Current Week page on all the other days. It’s a best practice to hide these two pages, otherwise the user will be able to navigate to those pages in a different way. If you do, don’t forget to include a Back button on the pages to get the user back again to the other pages in the report.
So, this blog shows you another way to create dynamic buttons in a Power BI visual report. Hopefully this is something that you can use in your next report!